Prioritizing product feedback by revenue at risk: Bellwether cross-references tickets, reviews, calls and NPS with the CRM
🕒 Published on Zendoric: November 11, 2026 · 00:19
✨ AI-generated · how it's made
This Towards Data Science article, published on November 7, 2026, proposes changing how B2B SaaS companies prioritize product feedback. Standard tools group tickets into themes and rank them by number of mentions.
📚 Go deeper
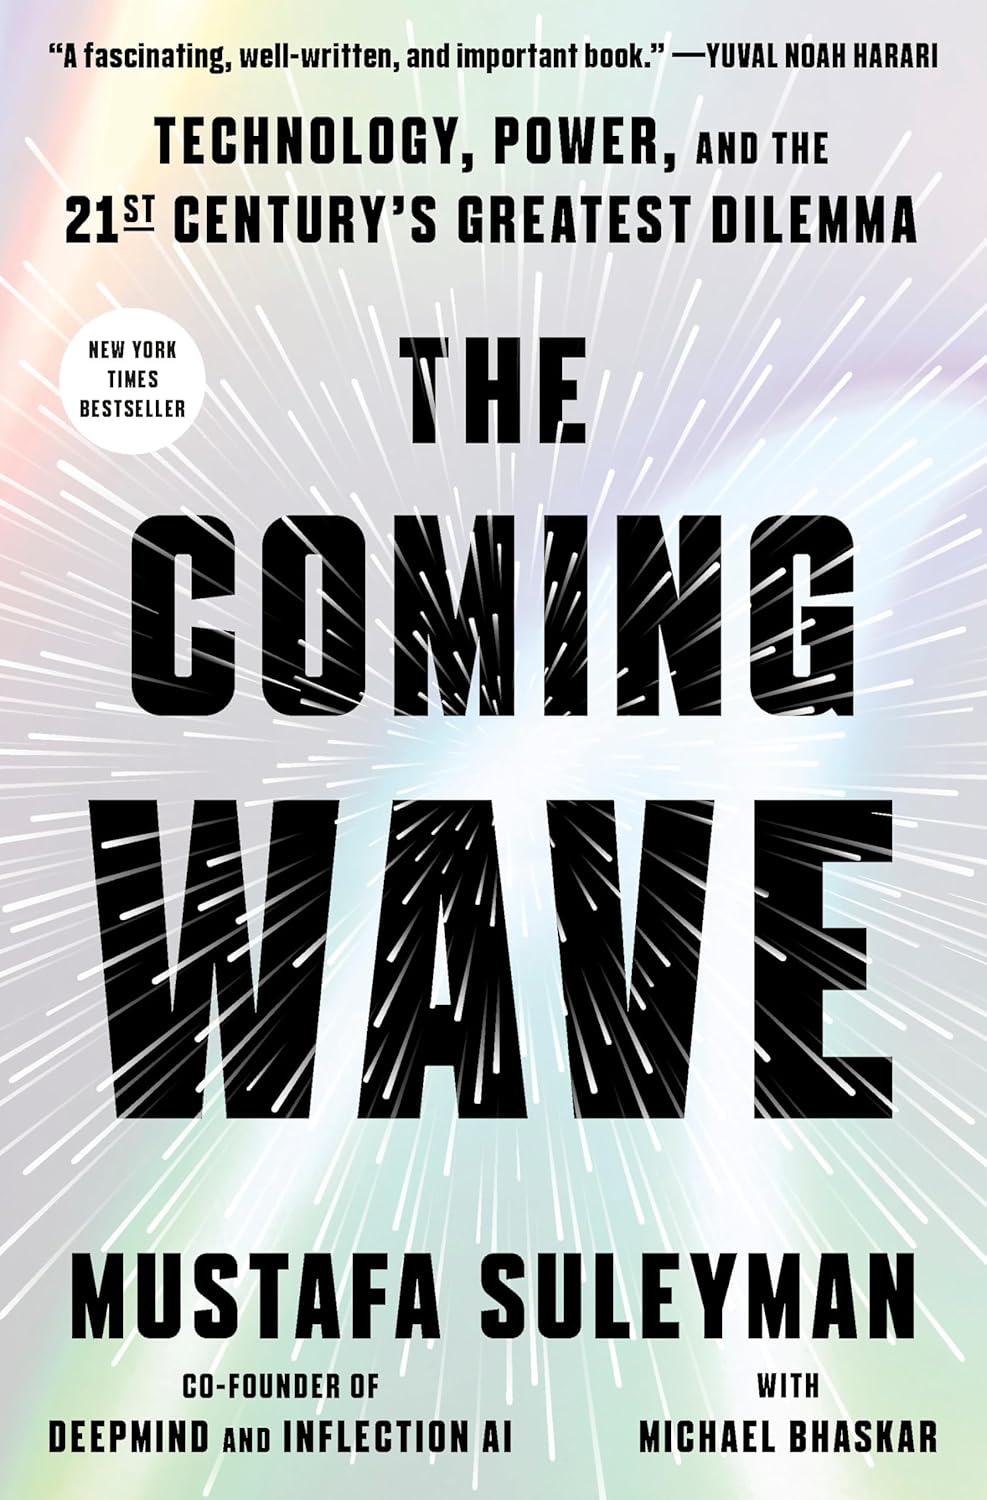
DeepMind co-founder on the dilemma of containing technologies that do not want to be contained.
As an Amazon Associate, Zendoric earns from qualifying purchases; the price does not change for you. · all our recommended books →
This Towards Data Science article, published on November 7, 2026, proposes a different way to prioritize product feedback at B2B SaaS companies. Standard tools group tickets into themes and rank them by number of mentions. The author argues that this approach is biased: whoever writes the most wins, and in the B2B products he knows, whoever writes the most is almost never whoever pays the most. A ticket from a five-person startup carries the same weight as a renewal call with a €4 million account: one row each. His proposed solution is to join feedback with the CRM, which does know how much each account pays.
A note on the source material: the text received is cut off in the middle of the second experiment. This summary does not cover the article's final conclusions, such as the three hardest problems the author says he encountered, beyond what appears in the downloaded portion.
An important caveat about the data. The article presents Bellwether, a tool the author built. In this version, ingestion and clustering are simulated. Everything revolves around a fictional company, Volta, a field service management SaaS. The accounts, quotes and euro figures are synthetic, and the themes are known by construction. The author states explicitly that “revenue at risk” is an estimate, not a measurement. What is real is the scoring layer. The analysis script regenerates the corpus, recalculates the figures and runs both experiments, and the code is public on GitHub. The figures below are not data from a real business, but results from a demonstration exercise.
The Volta scenario. The company has about €19.4 million in ARR (annual recurring revenue) and 10 named accounts: 6 enterprise and 4 mid-market. There are also two pooled segments: 214 SMB accounts and 1,890 self-serve. The corpus totals 6,693 signals from four sources and 10 themes above the noise threshold. The sources are 4,812 support tickets, 386 app store reviews, 291 notes from sales and renewal calls, and 1,204 NPS comments. Each source overrepresents a different segment. Tickets skew heavily toward SMB. Reviews come mostly from self-serve users (60%, according to the author). Sales calls come almost exclusively from enterprise (76% from the six enterprise accounts). NPS tracks the customer base, with the bias of who chooses to respond. Counting across all four sources does not cancel out these biases: it inherits all of them at once.
Three design decisions. The first is the unit of data: not a piece of feedback, but a signal that keeps its account. If the account identifier is lost at ingestion, nothing downstream can be valued and the product becomes just another clustering tool. The second is what “revenue at risk” means. It is not the full ARR of any account that has complained, but the affected ARR, filtered by the share of its signals raised in a churn, renewal or competitive context, and weighted by how close the renewal is. The third is that the weighting must be able to reverse the order, not just nuance it. A theme with 89 mentions has to be able to beat one with 903. Otherwise, the formula is just a count in disguise.
The formula. A theme's score is a sum over the accounts that raised it. Each account contributes its ARR, multiplied by the share of its signals on that theme in a “hot” context (churn, renewal or competition) and by a renewal-proximity weight. In the tool's version, proximity is a step function: full weight if renewal falls within three months, half within twelve and one fifth beyond that. The author stresses that these coefficients are a product decision, not a truth hidden in the data. That is why the method should be one click away from the figure that ends up on a slide.
The ranking shift. This is the demo's central result. By mentions, the order is: mobile offline mode (1,247), dark mode (903), notification noise (726), Excel export (588), bulk scheduling and batch editing (412), setup complexity and onboarding (341), billing accuracy (197), SSO and SCIM (89), API limits on ERP sync (63) and multi-region data residency (34). By revenue at risk, the order is: SSO and SCIM (€6.4M), data residency (€4.2M), bulk scheduling (€3.1M), API limits (€2.8M), onboarding (€1.9M), billing (€1.4M), offline mode (€0.9M), Excel export (€0.6M), notification noise (€0.3M) and dark mode (€50,000). SSO and SCIM rises from eighth to first: 89 mentions from seven accounts, six of them enterprise, totaling €15.7M in ARR. Data residency, the quietest theme, becomes second, and the author presents it as a regulatory requirement rather than a preference. Dark mode drops to last place with no enterprise call behind it. Each row opens a “receipt” with the accounts involved, their ARR, renewal dates and quotes with the associated account. The author sums it up this way: “a customer said this” becomes “€3.9M said this.”
75% of the noise, 8.5% of the money. Across the 4,600 clustered mentions and €21.6M of revenue at risk in the corpus, the four most-requested themes (offline, dark mode, notifications and Excel) account for 75% of mentions and 8.5% of revenue at risk. The three themes recommended by the board view make up 12% of mentions and 63% of the money. The two quietest, SSO and SCIM and data residency, contribute 2.7% of mentions and 49% of the money. Per mention, an SSO and SCIM request is worth about €72,000 at risk, and a dark mode request about €55. The author insists that the noisy themes are not wrong: offline mode is a real problem for technicians in basements, but it is cheap, and a volume-based ranking cannot tell you that.
Board view. The tool opens with a single sentence: shipping the top three themes this quarter protects €13.7M of ARR, 70% of the portfolio, across 10 account relationships. The author himself acknowledges that this figure is an upper bound, because it adds up three estimates that share accounts (Nordwind appears in all three themes, and Vinca and Adriano in two). Capped so that no account counts for more than its ARR, the figure drops to about €12M, 63% of the portfolio, and that is the one the tool should display. He admits it does not yet apply that cap. The same goes for the sum of all ten themes: €21.6M, more than the €19.4M portfolio, because one account appears in several themes. Without the cap, that sum is meaningless. The view also includes a revenue-at-risk versus effort matrix. The “quick win” is the ERP API limit: €2.8M for little effort, because raising a limit and flagging failures in a nightly job is days of work, not quarters. The renewal calendar shows €11.0M renewing within 90 days across 7 accounts. Dark mode and notification noise, with no enterprise signal, are assigned to a quality sprint rather than a board discussion.
How it was built. The author used Claude Code as a pair-programming tool, with Vite, React, TypeScript and Tailwind CSS for the app, and Python, pandas, NumPy and Matplotlib for the analysis. He says the first version came out looking like competitors' products (sidebar, rounded cards, colored badges), and he redesigned it as a financial report: serif headlines, tabular figures, thin rules and a single color, dark red, reserved for money at risk. He did not change a single number. His argument is that, for a tool whose job is to be believed, design is part of the argument.
The robustness experiment. Using a fixed seed, the script generates the 6,693 signals with the same themes, mentions, sources and biases. Each signal is assigned a random context and date. The pooled segments are modeled as their members, because an account that never wrote in cannot be at risk over a theme it never raised. The share of “hot” signals is a per-source base rate multiplied by a per-theme factor, calibrated so the expected score matches the tool's figure. In other words, the experiment tests whether the ranking holds, not whether the data is real. According to the author, nine of the tool's ten figures fall within the 5th-to-95th percentile band of 30 simulations, the order holds and the reversal test passes: SSO and SCIM with 89 mentions and €6.4M, versus dark mode with 903 mentions and €40,000. The exception is onboarding: the generator only reaches €1.9M if 96% of the theme's signals are “hot,” so the tool's figure is generous and the script flags it. The band is also the confidence interval the interface does not show. For API limits, with five accounts and 63 signals, it runs from €2.1M to €3.9M.
Experiment 1: three proximity functions. The score was recalculated using the step function, a linear decay to zero at 24 months and an exponential decay with a six-month half-life. All ten themes keep the same order under all three, with a Kendall's tau of 1.00 for each pair. The levels do move: the linear function raises dark mode by 44%, since its SMB accounts renew at six months, and the exponential lowers everything, by up to 20% for billing. The order holds because the gaps between consecutive themes are larger than what the function shifts. The narrowest, between offline mode and Excel export, is 11%. If two themes were only a few points apart, the function would decide between them, which is why it must be inspectable.
Experiment 2: losing the account identifier. The signals a tool cannot attribute are not a random sample: they are mostly reviews and NPS comments from the self-serve and SMB long tail. The author takes 30%, 50% and 70% of the 2,433 review and NPS signals, averaged over 30 simulations, in two scenarios. In scenario A the signals are dropped, and mentions and money fall together: at 70%, dark mode falls from 903 to 407 mentions and from €40,000 to €31,000. In scenario B, the realistic case, the signal is kept but without an account. The revenue column is the same by construction, but the board still sees 903 dark mode mentions while its revenue at risk drops 22% and only 45% of its mentions are valued. Notification noise keeps 726 mentions and loses 10%, and offline mode keeps 1,247 and loses 8%. Themes from named enterprise accounts rise: SSO and SCIM by 9%, because the NPS comments it loses were its lukewarm signals and the score is a ratio. Hence the practical conclusion: a number that rises when data is lost is not reliable on its own, and the share of valued mentions should be shown alongside it. The text cuts off at this point.
Key takeaways. The underlying idea is sound and useful for any B2B product team: keep the account attached to every request and value feedback using revenue and renewal data. But the article's striking figures (75% of the noise for 8.5% of the money, or the SSO and SCIM versus dark mode reversal) come from a synthetic corpus calibrated to produce that contrast. They show that the method can reverse a ranking and that the ranking is stable under variations in the proximity function. They do not show how much the order would reverse at a real company. Limitations acknowledged by the author himself include the uncapped per-account sum, the generosity of the onboarding figure, the absence of confidence intervals in the interface and the fragility in the face of signals with no attributed account.
📚 Go deeper

The definitive piece of investigative journalism on OpenAI: 260+ interviews, the clash between safety and speed, and the attempted firing of Sam Altma

How opaque algorithms decide who gets credit, a job or parole — and why they tend to punish the same people.
As an Amazon Associate, Zendoric earns from qualifying purchases; the price does not change for you. · all our recommended books →
🔗 Related on Zendoric